


INTRODUCTION
Brain mapping methodologies such as functional magnetic resonance imaging (fMRI), diffusion-tensor imaging (DTI), positron-emission tomography (PET), electrocorticography (ECoG), and magnetoencephalography (MEG) have been applied to structural and functional architectures on a large scale in combination with the analysis of high-dimension data. Such studies of brain connectivity have improved the understanding of cortical processing and the pathophysiology of neurologic disorders. A new notion that the human brain displays typical characteristics of both small-world and scale-free networks has recently been accepted.1,2 The concept of brain function has shifted from the older theory of a highly localized hierarchical structure involving models of localized cortical function to the new idea of a functional network of modules with a dynamic network structure.3,4 Analyses of dynamic functional networks can provide a better understanding how well neural activities work along these connections. The cortico-cortical evoked potential (CCEP) can be used to visualize functional networks by applying direct cortical stimulation. CCEP recordings from remote regions reflect orthodromic propagation of the stimulus through the cortico-cortical links. This method was first applied in patients using subdural electrode arrays to detect various functional cortical networks.5-15 Most CCEP connectivity patterns overlap the results from resting fMRI,15,16 but CCEP mapping can also give information about directional and causal connectivity. Thus, CCEPs can be used for evaluating brain function, inferring the degree of connectivity between areas, and defining the epileptogenic zone. Here we review the unique contribution of CCEP research for effective connectivity and cortical excitability intraoperatively and extraoperatively.
CONNECTIVITY
Mutual associations in relevant brain regions can be determined by anatomic, functional, and effective connectivities. Anatomic connectivity represents fiber bundles in the white matter, and is determined by the structure of neurons including every dendrite, axon, and synapse that can be observed by electron microscopy. At a more-macroscopic scale, DTI can reveal the anatomic connectivity based on the origins and terminations of white-matter tracts. Functional connectivity shows symmetric statistical relationships from the regional time course of cortical activation. The function of a set of organized areas can be evaluated using electroencephalography (EEG), MEG, PET, or fMRI. Directed measures such as anatomic and functional connectivity cannot explain the causal influences along structural links. Effective connectivity can provide the causality of connections and demonstrate directed interregional influence beyond reciprocal interactions. There are two ways to understand effective connectivity. First, noninterventional methods infer causality by analyzing simultaneous recordings of areas to quantify the directionality of functional connections using transcranial magnetic stimulation (TMS) or transcranial direct-current stimulation (tDCS).17,18 However, these methods do not directly measure directional interactions. Second, interventional methods apply an empiric perturbation to the activity in one set of neurons, and then quantify the responses evoked in other areas as dependent measures. Interventional approaches have traditionally relied on brain stimulation including direct cortical stimulation. As an interventional approach, CCEP mapping can directly measure neural activities from the localized cortical areas, indicating effective connectivity.
BRAIN STIMULATION
Brain stimulation in human in vivo has been used to probe various brain networks in order to evaluate cortical epileptogenicity and investigate aspects of cognitive function such as memory. Magnetic or electrical stimuli are used for functional brain mapping. In TMS, a magnetic field induces changes in the suprathreshold neuronal activities of cortical regions,18,19 the spatial extent of the neuronal modulation is unclear. In electrical stimulation, both direct electrical stimulation (DES) and microelectrical stimulation (MES) can be used. MES is usually applied to animals to investigate cortical neurophysiologic properties.20 DES, including tDCS and CCEP mapping, has the ability to visualize the directedness of connectivity in vivo. tDCS applies an electric current to induce changes in subthreshold neural activities,21-23 but its spatial extent is unclear. In contrast, CCEPs can be elicited using accurate localized stimulation to identify activities across networks, and yield maps with excellent spatiotemporal resolution.24
Conventional DES has been used for many decades with a good reliability and safety despite some variabilities in the elicited responses. There are two types of brain electrical stimulation based on the stimulation frequency: 1) low-frequency stimulation (also known as Penfield paradigm or traditional stimulation) having an interstimulus interval of 20- 50 ms and a stimulus rate of 20-50 Hz, and 2) high-frequency stimulation (also known as the Tamiguchi method or shorttrain stimulation) having an interstimulus interval of 4-5 ms and a stimulus rate of 200-250 Hz. Extraoperative DES uses the Penfield paradigm while intraoperative neurophysiologic monitoring applies a short-train technique. Regarding the electrical polarity of the stimuli, anodal stimulation is applied to radially oriented cortical areas while cathodal stimulation is applied to direct subcortical tracts and tangentially oriented structures.
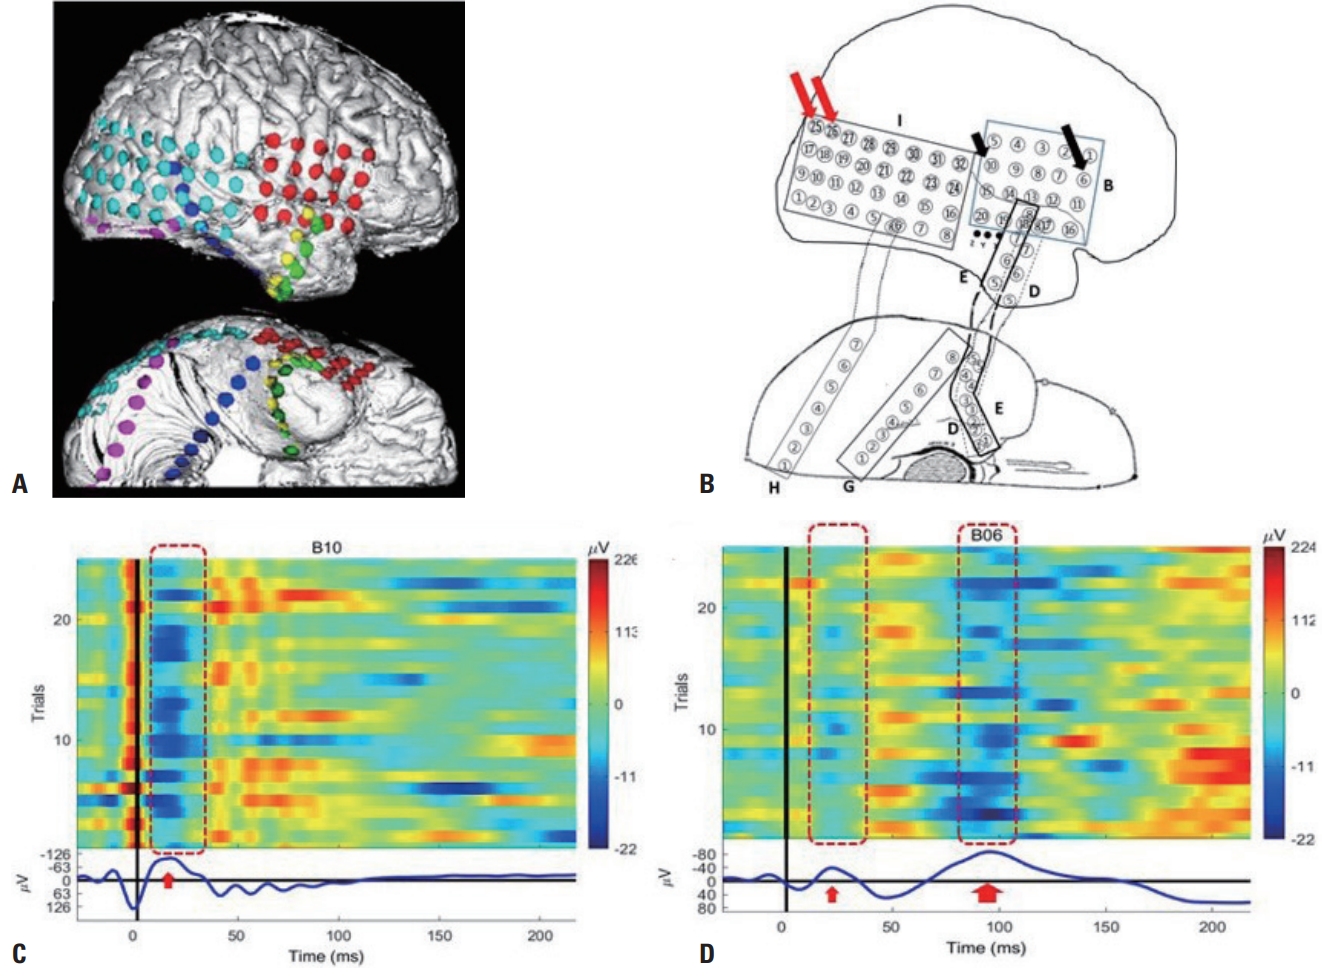
The CCEP can be revealed by averaging time-locked responses after applying the stimuli. A consensus on the standardized parameters of the CCEP has not been established yet. However, a common stimulus condition for CCEPs involves square-wave pulses with a duration of 0.3 ms, a frequency of 1 Hz, and an intensity varying from 2 to 12 mA in stepwise increments of 2 mA. The intensity of the applied current is increased up to 80-100% of the intensity that induces either positive responses or afterdischarges during conventional stimulation. A bipolar CCEP is induced using two adjacent electrodes in an alternating fashion. This alternating polarity avoids polarization of the stimulating electrodes, the accumulation of electrical charge in the stimulated cortex, and stimulation artifacts. Either EEG seizures or afterdischarges should be detected by simultaneous ECoG monitoring because they make positive responses meaningless. The typical recording parameters are a bandpass filter from 1 to 1,000 Hz, a sampling rate of 1,000-2,500 Hz for each channel, and averaging 40-60 samples in each session. Regarding the selected time window, the prestimulus recording period is 100 ms and the poststimulus period is 400 ms. In each session, the reproducibility of the responses can be confirmed by superimposing two separately averaged trials at the appropriate intensities. Raw EEG data acquired for each stimulation are extracted, and CCEPs are obtained by the offline averaging of data that are time locked to the stimulus onset. The averaging of CCEP data is usually performed and reviewed using MATLAB. The early N1 and late N2 components of the responses are analyzed, which occur at 10-30 ms poststimulation (indicating anatomic connectivity) and at < 200 ms poststimulation (long-lasting effective connectivity). CCEP responses measured using subdural grid arrays are consistent. However, those measured using stereo-EEG often show inconsistent morphology because electrodes can be located in both the gray matter and white matter, or within sulci.25 The stimulation protocol is safe, in that it does not cause localized tissue injury.26 For excitability, single-pulse electrical stimulation (SPES) is used and delayed responses (DR) are analyzed.
CORTICAL RESPONSES EVOKED BY ELECTRICAL STIMULATION
Electrical stimulation evokes three different categories of cortical responses: the cortical evoked potential (also called the direct cortical response [DCR]), the axono-cortical evoked potential (ACEP), and the cortico-axono-cortical evoked potential (CACEP). The DCR is recorded near the stimulation area, and its polarity depends on the direction of the stimulation. The amplitude peaks at 15-25 ms after the stimulation onset. When a weak stimulus is delivered, a negative deflection called the primary negative potential occurs after 20 ms, reflecting excitatory postsynaptic potentials of apical dendrites.27 In addition, the DCR depends on the local cytoarchitectonic organization,27 and it can be used to estimate the electrophysiologic state of a particular area as excitability in real time and in vivo. 28 The ACEP can be elicited when the subcortical areas are exposed during the resection of a brain tumor.29 It can be recorded at a site that is quite distant from the stimulated area.30 The amplitude peaks at 10-25 ms after starting the stimulation and before the DCR. The ACEP can be obtained by propagation in the white matter toward the distal region. The CACEP can be obtained when the location of recording in the cortex is remote from the stimulated area.16,24 This is the true CCEP, reflecting a postsynaptic potential on the cortex, but sometimes artifacts such as sustained stimulus artifacts and baseline drifts can disturb the recorded responses. The stimulus artifacts usually last less than 5 ms. They could be differentiated from the first volley of the N1 response that appears more than 10 ms after stimulus onset. Baseline drifts are more evident at electrodes near the stimulation site. High electrode impedance and the presence of CSF beneath electrodes can increase the size of these artifacts. Lowering the stimulus intensity may allow visualization of the waveforms that are obscured by those artifacts.
Electromechanistic basis of the CCEP
The CCEP involves physiologic changes at the stimulation site and responses at the projection site. In the stimulated cortex, current applied to the surface of the cortex can activate the following structures: 1) local pyramidal cells in cortical layers II-VI by direct depolarization, 2) local inhibitory interneurons at layers II and III, and 3) traversing axons at the stimulation site to feedforward distal synapses and to feedback pyramidal cell bodies. An animal study found that most of the responses came from the superficial lamina to the deep lamina.31 Local responses then spread into the connected regions via mono- and polysynaptic projections.32 At the projected site, field potentials are generated by pyramidal neurons. An analysis of the lamina current source density of cortical responses revealed that short (< 1 ms) sensory stimulation evokes an earlier 10-40 Hz surface-negative excitatory response lasting 10-20 ms, followed by 1-4 Hz complex postsynaptic responses in all cortical layers with a longer duration. The early N1 component of the CCEP is similar to the early excitatory cortical response from orthodromic input, while the later N2 component is related to the late complex response.33 The late responses (LR) elicited by the briefest stimulation can be related to recurrent relay volleys with sequences of excitation and inhibition that drive local oscillations.34
Analysis of CCEP waveforms
The two response peaks of the CCEP are shown in Fig. 1. In a CCEP recording, stimulus artifacts are seen and then the N1 component is observed at 10-30 ms, which can be easily distinguished from stimulus artifacts since it is characterized by the first prominent negative deflection. The N2 peak follows the N1 peak. The amplitudes of the N1 and N2 components can be measured as their peaks to the following or preceding troughs, and their latencies are measured from the stimulus onset. A single neuronal firing by epicortical stimulation evokes an early excitatory response during the N1 time window, followed by a long-lasting and slow inhibition during the N2 time window.
Data from laminar multicontact recordings have shown that SPES can elicit increased multiunit activities in the deep cortical lamina (layers IV-VI), suggesting a pyramidal activation. Thereafter the stimulation can evoke decreased multiunit activities in layers III-V. The decreased activities resemble the laminar features of sleep waveforms (K-complex and slow-wave sleep).
The early N1 component is recorded at the closest site. It is an excitatory event comprising the depolarization of pyramidal cells in deep cortical layers across multiple synapses, reflecting neuronal activities from the direct connections and predicting the presence of underlying anatomic projections, as does DTI. The amplitude of the N1 component is positively correlated with the number of connected white-matter fibers, suggesting the strength of anatomic connectivity between two regions.6 In contrast, the late N2 slow waveform is recorded at the remote site, and it is accompanied by suppressed action potentials. Thus, the N2 component represents a longer lasting and slower inhibition, partially reflecting function connections.16
CCEP mapping of the local electrical activity can provide interpretable data that are comparable to those obtained using noninvasive, indirect measurement methods. A neuronal basis of neuroimaging signals can be explained by CCEP mapping. Knowledge of the connectivities within a single subject will provide insight into the underlying neural circuitry that is determined by influencing factors such as electrode orientation relative to the underlying cortex, cytoarchitectural structure, and connected fiber density.
CCEP mapping with network measures
CCEP mapping allows the flow direction of information to be assessed at the onset site where electrical activities are perturbed and the cortical responses measured at another site that are influencing specific cognitive processes. Most connections at one node are highly reciprocal, such that the inflow (indegree) and outflow (outdegree) determine the net flow. The net flow can be estimated by computing connectivity matrices. A case report has shown that precentral and postcentral gyri exhibit strong outflow, while superior parietal and lateral prefrontal areas involved in the default mode network exhibit a strong inflow. The net flow in motor and language functional areas are also outward with a high outdegree.35 Although interpretations are controversial, the properties of a CCEP network can provide comparable data for studying the resting cognitive state.
PRACTICAL IMPLICATIONS OF CCEP MEASUREMENTS
Stimulating discrete areas elicits CCEPs in the brain areas with effective connectivity. Many CCEP studies have visualized various cortical networks, including language, cognitive motor, auditory, and visual systems, as well as frontal, limbic, and interhemispheric connections (Table 1). The CCEP can be measured both intraoperatively as well as extraoperatively. SPES can also be used for measuring cortical excitability.
CCEP mapping of the language system
Comprehensive connectivity mapping of the CCEP for the language system has delineated the locations of eloquent areas in the lateral neocortical dominant hemisphere (fronto-temporo-parieto-occipital regions). Language processing can be explained by a dual-stream model comprising a dorsal stream for phonologic processing and a ventral stream for semantic processing.24,36,37 The superior longitudinal fasciculus and the arcuate fasciculus (AF) are the pathways in the dorsal stream, while the inferior fronto-occipital fasciculus (IFOF), the inferior longitudinal fasciculus (ILF), and the uncinate fasciculus (UF) are those in the ventral stream. The IFOF consists of deep and superficial components. The deep components originate from the orbitofrontal, dorsolateral prefrontal, and middle frontal regions, while the superficial components come from anterior parts of frontal areas (anterior parts of the inferior frontal gyrus: pars orbitalis [pOrb] and pars triangularis [pTri]). These components terminate posteriorly at the posterior temporo-basal area, the occipital lobe, and the superior parietal lobule. The dorsal stream spans from the posterior language area (WernickeŌĆÖs area) to the anterior language area (BrocaŌĆÖs area). In contrast, little is known about the underlying connections of the ventral stream despite its importance in language comprehension and semantic network. The ventral stream usually starts from superior temporal (anterior/middle parts), middle temporal, inferior temporal (anterior part), and ventral temporal (anterior fusiform) regions.
A CCEP study has shown that anterior temporal (AT) regions are not included in the IFOF, but receive terminations from the ILF (anterior-ventral area and temporal pole) and the UF (temporal pole), and have direct connections to the anterior part of the IFG.38 The pOrb is known to be related to executive function in semantic cognition tasks. Thus, the AT regions are not the main part of the ventral stream, but a semantic representation hub that is crucial in semantic cognitive function. Ventral parts of the AT regions are regarded as the basal temporal language area (BTLA) that is essential in multimodal semantic processing of receptive and expressive language. Shimotake et al.39 suggested that ventral parts of the AT lobe could be regarded as one of the hubs in this network. One neurosurgical outcome study found that verbal and memory could be improved by preserving the BTLA and its pathway.40 The posterior part of the basal temporal area (posterior fusiform gyrus) is crucial in visual word formation.
The IFG consists of three subdivisions: pOrb, pTri, and pars opercularis (pOpe). A CCEP study of connectivity from subdivisions of the IFG to the temporoparietal areas revealed that the pOrb is connected to the anterior lateral temporal cortex and angular gyrus, and that the pOpe is connected to the posterior temporal cortex and the supramarginal gyrus.41 Stimulation of the anterior parts of the IFG (pOrb and pTri) can induce semantic errors during picture naming, indicating that these parts are related to semantic processing. CCEP studies of functional dynamic connectivity between the posterior parts of the IFG (pOpe and pTri, also called BrocaŌĆÖs area) and the posterior temporal and inferior parietal regions have found that the connectivities are graded, with the more-anterior parts being related to more-general modalities, and the more-posterior parts being related to more-specific modalities.24,30
CCEP mapping of frontal and insular networks
CCEP studies of the prefrontal cortex (PFC), premotor area (PMA), and supplementary motor area (SMA) have revealed projections from the PFC to the ipsilateral medial PFC and PMA, from the ventral and dorsal parts of the PMA to ipsilateral frontoparietal regions, and from the SMA to bilateral frontoparietal regions. Connectivities have also been demonstrated from the pre-SMA to ipsilateral medial and lateral frontal regions and the contralateral pre-SMA, from the frontal operculum to the temporal operculum and the ipsilateral insula, and from the anterior insula to the frontotemporal operculum, ipsilateral medial, and lateral frontal areas. Also, the connectivity from ventral parts of the PMA and SMA was found to be more developed in the dominant hemisphere.42
Some CCEP studies of laterality in the insula have found the left side to be more heavily implicated in language function, with the right side contributing more to saliency processing, sensory function (e.g., vestibular function), pain, and somatosensory function. The posterior insula usually tends to show contralateral connectivities, while the connections to the primary auditory cortex and mesial temporal area have bilateral tendencies. Regarding visual function, Dionisio et al.43 reported the novel finding that the right posterior insula is directly connected to the left visual cortex.
Both insular lobes also have strong connections to adjacent fronto-parieto-temporal areas as a multimodal area involved in sensory processes (general somatosensory, auditory, general viscerosensory, olfactory, and gustatory systems) and cognitive processes (decision-making, social cognition, and attention). These connections might explain the diversity of insular seizures, such as early viscerosensory, somatosensory, and hypermotor seizures that mimic temporal, parietal, and frontal seizures. Such mimicry may lead some clinicians to resect the incorrect cortical area. Thus, multivariate connectivity analysis including of CCEPs can be used for more-accurate evaluations of causal relationships during the onset and propagation of the ictal period.44
CCEP mapping of the limbic system
The limbic system consists of the limbic and intralimbic lobes, paralimbic areas, and subcortical structures, having strong connections to cortical and subcortical areas and even the brainstem. Some CCEP studies of the limbic system have revealed effective connectivities of the cingulate gyrus (CG), hippocampal formation (HF), orbitofrontal area, and amygdala.11,45,46
The anterior CG has connections to ipsilateral medial parts of the fronto-parietal lobes, while the posterior CG projects to lateral parts of the parieto-occipital lobes and bilateral medial temporo-parieto-occipital regions. Also, the anterior CG has more projections into the dominant hemispheric network, supporting the interhemispheric asymmetry of white-matter fibers. Bilateral broad connections of the posterior CG contribute to the difficulty of interpreting medial parietal ictal EEG data.11
Differences in stimulation patterns between the anterior and posterior parts of the HF have been reported. Posterior HF stimulation can induce CCEPs in ipsilateral temporal areas and the posterior CG following the Papez circuit,47 while anterior HF stimulation can elicit additional CCEPs in the ipsilateral medial orbitofrontal regions and insula as well as the temporal and cingulate regions.11 The parahippocampal gyrus (PHG) with main efferents of the hippocampus has projections to the ipsilateral hippocampus and posterior CG,11 indicating that the PHG acts as an important node for the processing of hippocampal outputs. Studies of paralimbic structures have shown that orbitofrontal stimulation including in the medial and lateral areas induces responses only in the adjacent cortices, whereas broad connections to frontal and temporal areas are observed in animal studies.11,45
One study of the amygdala showed broader projections including of ipsilateral temporal structures, insula, CG, medial and lateral frontal areas, and the inferior parietal lobule.11 The amygdala has broad connections that play a role in integrating information processing between cortical areas (prefrontal/temporal association cortices) and the subcortical nucleus (hypothalamus). Yakovlev46 proposed an emotion-control network that includes the amygdala, insula, CG, AT region, orbitofrontal areas, and the thalamic dorsomedial nucleus. Thus, CCEP investigations can be used to visualize broad connections in limbic and nonlimbic structures such as the Yakovlev-Nauta circuit.
CCEP mapping for intraoperative use
CCEP measurements can be applied to intraoperative neurophysiologic brain monitoring and mapping for determining the integrity of connections by applying cortical and subcortical stimulation, and for probing epileptogenicity. Because CCEP responses are easy to measure and reproducible, intraoperative CCEPs have been clinically utilized for mapping and monitoring functional networks in the eloquent areas, especially in the dorsal language network during neurosurgery.48-50 Although several factors need to be considered during surgery, such as the electrophysiologic environment, patient condition, and general anesthesia, CCEPs have the advantage of rapid waveform acquisition. An evaluation based on network analysis can be performed rapidly, and it takes less than 1 minute to measure CCEP responses to a stimulation applied at one location.
Yamao et al.30 reported that intraoperative SPES of BrocaŌĆÖs area (pTri and pOpe) can elicit CCEPs in WernickeŌĆÖs area via the AF. Intraoperative sequential CCEP monitoring of the AF can be reproducibly performed during general anesthesia. The CCEP connectivity pattern can be successfully used to localize the core anterior language. Stimulation at 50 Hz to awake patients can induce language impairment in all patients, which makes intraoperative CCEP monitoring clinically useful for determining the integrity of language and motor networks in eloquent areas.41 Sequential monitoring of the CCEP could prevent persistent functional impairment, and be used to predict the postoperative outcome of monitored functions and delineate the margin of resection to ensure optimal surgery. Applying a cutoff of a 50% reduction in the amplitude of the CCEP N1 component has been suggested for preventing permanent language dysfunction.48 Monitoring CCEPs has recently become feasible during intracranial vascular or brain tumor surgery near eloquent areas of an awake patient during craniotomy.
Valent├Łn et al. reported that SPES can elicit a delayed component with high reproducibility even in an intraoperative setting.49,50 The distribution of DR under general anesthesia corresponds to that in an extraoperative interictal state. Intraoperative SEPS could not only be used to probe epileptogenicity, but also as an adjunctive method to improve the installation of intracranial electrodes even when epileptiform discharges are not observed. A recent study has shown that an intraoperative combination of CCEP measurements with high gamma activity mapping in epilepsy surgery enables abnormal networks and clinical parameters to be detected for improving the postoperative outcome.51
Cortical excitability and SPES
Studies have found that SPES can induce LL in some cortical regions for predicting the topography of seizure onset.5,49,52,53 SPES elicits two types of waveforms: early responses (ER) and LL (Fig. 2). ER start immediately after the stimulation, and are considered as normal responses that can provide information about cortical connectivity. LL are observed in some areas with the morphology of DR or repetitive responses (RR), reflecting abnormal cortical excitability related to the epileptogenicity of the underlying cortex. These responses have differences in both their waveforms and electrophysiologic basis. While DR have a sharp or spiked morphology occurring between 0.1 and 1 seconds after stimulus onset, RR have repetitive sharp waveforms or complex slow-wave morphology after the initial ER. RR are often widespread (event bilateral), suggesting the involvement of long pathways such as thalamocortical loops. This observation is consistent with the evidence that generalized epileptiform discharges originate from discrete cortical foci or a secondary bilateral synchrony.52 The distribution of LL has been demonstrated to correspond to seizure onset areas.49,50
After applying electrical pulses via intracranial electrodes, accentuated CCEP amplitudes could be recorded near ictal onset zones, reflecting a pathologic state in the areas associated with the epileptogenic zone. Enatsu et al.54 showed that excitability is increased more in areas having an ictal pattern of repetitive spikes than in regions showing a pattern of paroxysmal fast activity using the SPES method. Those authors suggested that cortical excitability could vary depending on the pattern of seizure onset. SPES often elicits high-frequency activities that are similar to high-frequency oscillations superimposed on epileptiform discharges. Usami et al.55 demonstrated that a high gamma power is strongly correlated with the N1 amplitude, becoming larger during non-REM sleep than during the waking period, and largest in the frontal lobe, explaining why patients with frontal lobe epilepsy experience frequent nocturnal seizures.
CCEP and epilepsy
Epilepsy is thought to be a network disorder involving a network of brain areas rather than a single region.56 The state of the network can be evaluated by CCEP mapping, which can be performed during both interictal and ictal periods in epilepsy patients. The CCEP can provide a better understanding of both functional and pathologic networks in epilepsy patients, and it can also give insight into the mechanism underlying seizure propagation.
The cortical region is involved in seizure initiation and spread, potentially localizing epileptic regions as the origin and related areas. CCEPs in physiologic areas appear as N1 and N2 responses within 0.2 seconds of the stimulation. However, CCEPs in epileptic regions include LL (at 0.2-1 seconds poststimulation) with a spike or sharp morphology localized to the epileptogenic zone.49 A CCEP study of epilepsy demonstrated that the ictal onset zone had greater increases in amplitudes than did the region outside the zone, without showing any difference in latencies or stimulus thresholds. Both the structural connection strength and effective connectivity (amplitude, variation, and outflow) become accentuated in the epileptogenic zone.54,57,58
In epilepsy patients with frontal, temporal, and opercular insular seizures, CCEP analysis can be used to understand the seizure semiology and optimize delineation in areas to be resected.44,59-61 During CCEP mapping, afterdischarges can occur in pathologic areas, which may give additional clues for localizing epileptogenic areas.49 The surgical outcome is worse if tissue exhibiting late afterdischarges is not resected.49 Despite the rapid spread of seizure activity and the limited sampling in suspected areas of epileptogenicity, combining CCEP measurements and ECoG yields more comprehensive information. Moreover, the results can help clinicians to localize the seizure onset zone more precisely. Thus, the CCEP is a promising adjunctive tool for complete assessments of abnormal brain connectivity and excitability for determining the ictal origin and propagation in epilepsy.
LIMITATIONS OF CCEP MAPPING
The main limitation of the CCEP is that electrodes have restricted spatial coverage due to their limited sampling issues; for example, this makes it difficult to evaluate subcortical structures such as the fornix, hypothalamus, and brainstem, which are well connected to cortical areas. Such spatial limitations could be compensated by other techniques such as MEG, fMRI, and PET.
CCEPs also have several methodological limitations. The inconsistencies in the specific parameters applied in different studies make accurate comparisons extremely difficult. These parameters usually include the intracranial electrode type (subdural versus depth), stimulus configuration (monopolar versus bipolar), pulse duration (0.1-0.5 secodns), interpulse interval (0.5-10 secodns), number of pulse repetitions (10-50), and pulse intensity (1-12 mA).15 Furthermore, it is difficult to keep the state of a subjectŌĆÖs cognitive function stable during the measurements, while antiseizure medications (particularly sodium-channel blockers), anesthesia, and wakefulness can also affect the CCEP amplitude. Additionally, current stimulation across two stimulating sites can result in artifacts lasting 5-10 ms that will mask mono- or disynaptic potentials. The stimulation artifacts can be reduced by decreasing the stimulation intensity, and using stimuli of low intensity may be more closely related to physiologic responses.
The mechanism underlying the generation of the elicited responses is not yet fully characterized at the circuit and cellular levels. CCEPs form in the recording area due to orthodromic propagation along excited pyramidal neurons plus orthodromic or antidromic propagation along activated axons below the stimulated region. The cortical neuronal orientation, architecture, and signal processing under the recording electrode can also influence the components of the CCEP. However, the degree to which CCEPs reflect the number and strength of activated neurons and axons cannot be accurately determined since the relationships of the polarity, amplitude, and latency of the elicited waveforms with the cortical cellular properties under the electrode cannot be fully characterized.
Finally, CCEP studies are often criticized due to attempts to apply their findings for subjects in a pathologic state to the normal cognition and connectivities of the general population. However, the individual variability inherent in the pathophysiology and electrophysiology of various diseases is not likely to significantly affect CCEP findings that are consistent across physiologic and pathologic states. Thus, CCEP results obtained from patients with diseases such as intractable epilepsy might be generalizable to the normal population.
PROSPECTS OF THE CCEP AND NETWORK MAPPING
A CCEP study can visualize the changed network activity by stimulating a target structure. Electrical deep-brain stimulation of the fornix has revealed distinct spatiotemporal network activation patterns of the CCEP.62 Such investigations can yield quantitative evidence that nodes with stimulation-induced cortical activation exhibit changes in poststimulation cortical excitability. They could lead to new therapeutic applications involving a stimulation-induced network activation paradigm for neurologic diseases with functional impairments.
Task-specific stimulation in a waking state can influence brain activity. Modulation of neuronal activation by stimulating subjects electrically during cognitive tasks can be used to investigate the causality of specific cortical areas involved in cognition processes underlining the observed behavior; for example, spatial memory can be improved by electrically stimulating the entorhinal cortex at a high pulse rate.63,64 Experiential phenomena can be induced only if stimulating the visual cortex activates the temporo-parietal junction.64 Stimulating the fusiform face area by presenting a face image resulted in a large reduction of the N2 component but not the N1 component. This suggests that the N2 component is related to higher cognitive processes while the N1 component is sensitive to more-automatic processes. Those findings might indicate that CCEP mapping during cognitive tasks is likely to provoke task-related reorganization of largescale brain connectivity networks.
In CCEP mapping, the subjectŌĆÖs subnetworks are specifically stimulated by electric current, and the subject can be in a resting state or stimulated by an external sensory modality. The specific stimulation applied to the subnetworks forces a targeted focal cortical area to be activated or disrupted, with it likely that local and global networks will be subsequently reorganized. Thus, such CCEP mapping can yield information on large-scale networks present in the structure of the human brain. The results of CCEP mapping and other stimulation measures (TMS and MES) are also comparable. Analyzing CCEP data using the SEEG approach is able to supplement other network topographic tests, and is likely to improve knowledge about the roles that networks play in human brain function.
CONCLUSION
Measuring CCEPs with or without SPES is a useful brain mapping method that is feasible after installing an intracranial electrode array. N1 and N2 responses are recorded within 0.2 seconds of applying the stimulation. The N1 component is the earliest CCEP, representing excitation of pyramidal neurons in the recording area and partially reflecting the strength of structural connectivity between areas. The N2 component reflects a long-lasting network effect that is affected by aspects of brain function and state such as cognition and arousal. Abnormal LL (DR or RR) can be recorded between 0.2 and 1.0 s after applying the stimulation, localizing the epileptogenic zone. Modulation of task-specific CCEPs during cognitive processes can influence functional networks and outline, reflecting the effect on the reciprocity of brain networks.
This electrophysiologic method can be a useful technique for providing insight into brain dynamics and functional connections, but it is currently underused. The CCEP might enable us to understand the causal relationships of effective connectivity during cortical information processing, and to develop a new paradigm of effective therapeutic neuromodulation in the future.